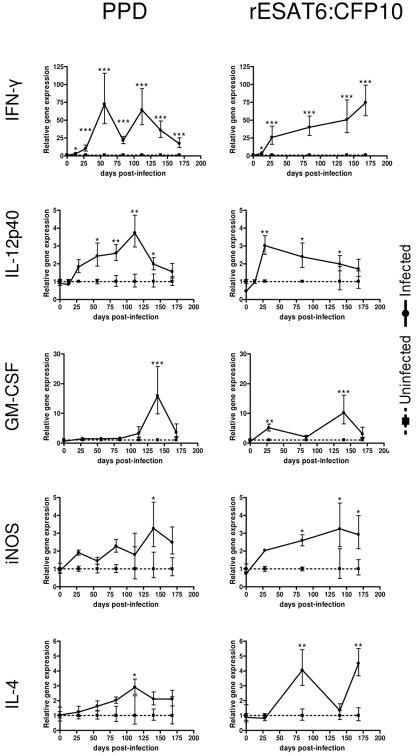
FIG. 3.
Cytokine gene expression. Gene expression was measured in PBL from infected and uninfected animals stimulated with PPD or rESAT6:CFP10. Data were normalized by subtracting the control animals from the infected animals. Data are presented as the means ± SEMs (error bars). Data show infected versus uninfected animals at each time point. *, P < 0.05; **, P < 0.01; ***, P < 0.001.

