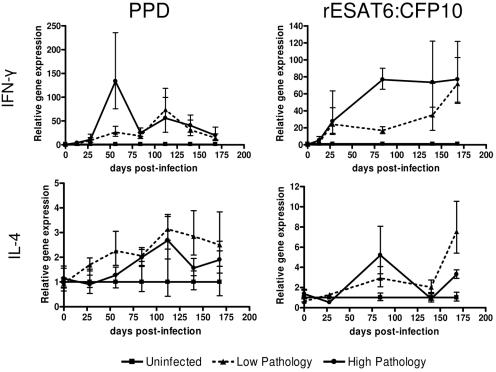
FIG. 4.
Cytokine expression in animals with differing pathologies. Animals were divided into groups based upon their total pathology score. Animals with total pathology scores of greater than 15 were placed in the high-pathology group. Infected animals with pathology scores of less than eight were placed in the low-pathology group. Uninfected animals are included for comparison. Data were normalized by subtracting the control animals from the infected animals at each time point. Data are represented as the means ± SEMs (error bars).

