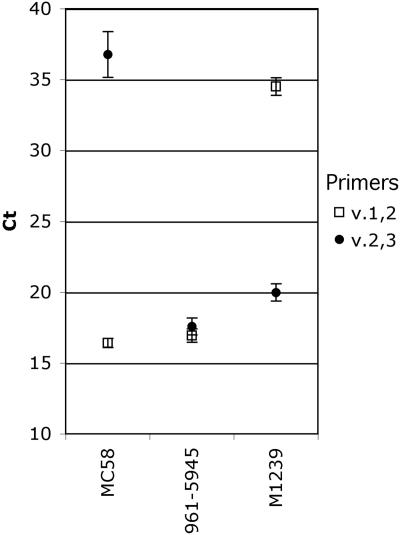
FIG. 4.
Results of a QPCR using bacterial colony suspensions as templates. A single colony from each prototype strain was suspended in buffer in five replicates, which were used as templates in QPCR with v.1,2 and v.2,3 primer pairs. Data points represent the mean CTvalues, and error bars correspond to the standard deviations (1σ).

