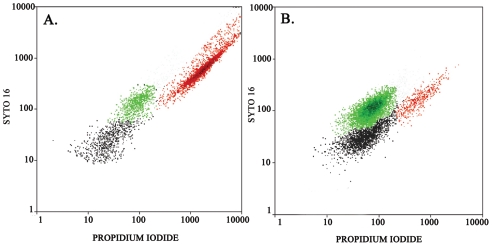
FIG. 1.
Live/dead analysis of necrotrophic growth. Both plots show Syto 16 fluorescence in the ordinate and propidium iodide fluorescence in the abscissa. Red dots indicate dead P. putida cells, green dots indicate live L. pneumophila cells, and black dots indicate dead L. pneumophila cells (colors are for visualization purposes only and do not correspond to actual fluorescence wavelengths). (A) L. pneumophila plus dead P. putida at 0 h; (B) L. pneumophila plus dead P. putida cells at 96 h.

