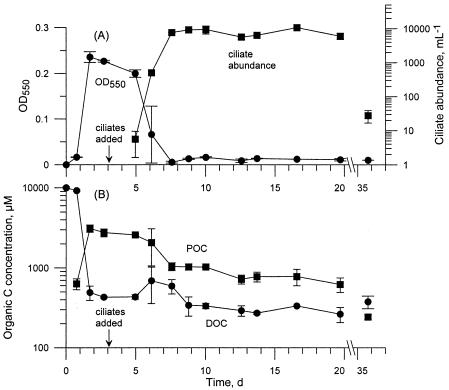
FIG. 2.
Bacteria plus bactivorous protozoan experiment. (A) Average ± SD optical density and ciliate abundance over time. (B) Concentration of organic carbon in dissolved and particulate phases. Note the axis break between 20 and 35 days and the logarithmic scales for ciliate abundance and carbon concentration.

