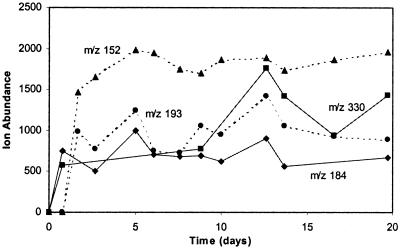
FIG. 3.
Examples of new m/z values and ion abundance values identified in positive mode on day 1 (solid line) and on day 2 (dotted line) that remained present for the duration of the experiment. Note that ion abundance is not a direct measure of concentration because ion abundance varies per compound in the ESI-MS technique.

