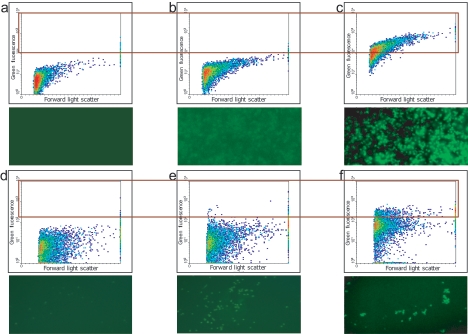
FIG. 1.
FC (top) and fluorescence microscopy (bottom) analyses of fixed cells of M. capsulatus (a to c) and Methylomonas sp. strain LW13 (d to f). (a and d) No probe; (b) nonspecific probe (NON-EUB338); (c) type I methanotroph-specific oligonucleotide probe (MG84/705); (e and f) Methylomonas sp. strain LW13 mmoX-specific polynucleotide probe; (e) cells grown in the presence of Cu; (f) cells grown without Cu. Each plot contains 10,000 events. The boxed part of the plot indicates the events gated for sorting.

