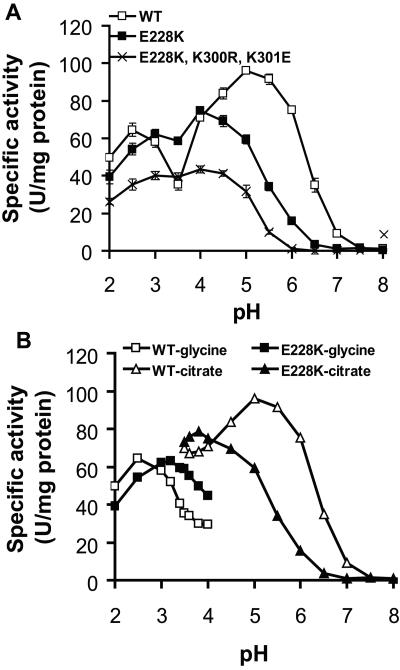
FIG. 2.
Comparisons of pH profiles of the WT, the single mutant E228K, and the triple mutant E228K-K300R-K301E. In both panels, values are expressed as the mean specific activity ± standard error (n = 3) (for panel B, standard errors were too small to be seen) of the purified enzymes at each pH, and phytase activity was determined using sodium phytate dissolved in the designated assay buffer. (A) pH 2.0 to 3.5, 0.2 M glycine-HCl; pH 4.0 to 6.5, 0.2 M citrate; and pH 7.0 to 8.0, 0.2 M Tris-HCl. (B) pH 2.0 to 4.0, 0.2 M glycine-HCl; pH 3.5 to 6.5, 0.2 M citrate. Overlapping pH points between the two buffer systems and smaller intervals were used to compare the buffer effect and the exact optimal pH of the testing phytases.

