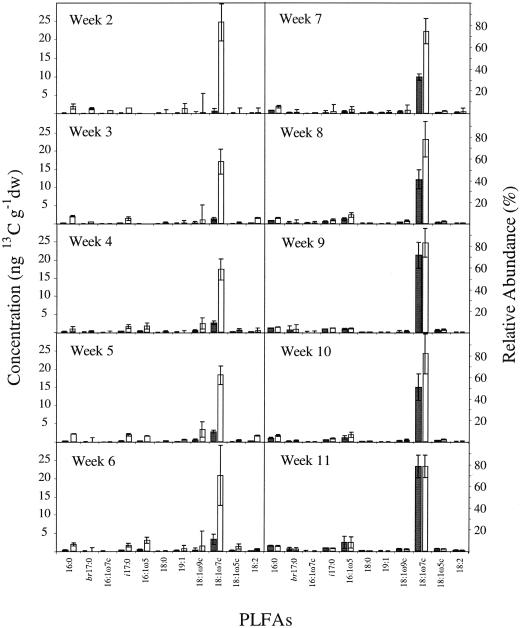
FIG. 2.
Total concentration of 13C label incorporated into each PLFA in ng of 13C g−1 (dwt) of soil (black bars) following incubation with 2 ppmv of 13CH4 and relative mole percentage abundance (white bars) for the main 13C-labeled PLFAs from 2 to 11 weeks following incubation with 2 ppmv of 13CH4. PLFA analyses were performed on soil samples taken at weekly intervals, and only PLFAs with a relative abundance of >3% are presented. Error bars represent ±1 standard deviation.

