
Fig. 1.
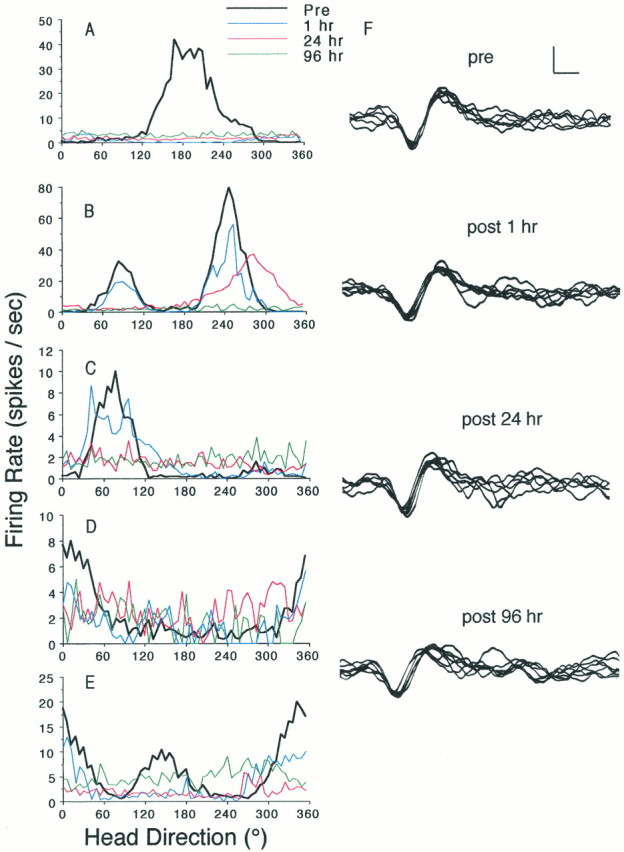
Time course of vestibular lesion-induced disruption of ATN HD cell firing properties. A–E,Firing rate versus HD tuning curves of five different ATN HD cells before and after intratympanic injection of sodium arsanilate. In each plot, the heavy black line (Pre) depicts the prelesion baseline activity of the cell. The remaininglines depict postlesion sampling times and are color coded as follows: blue, 1 hr; red, 24 hr; andgreen, 96 hr. For cases in B–E the disruption of directional firing properties paralleled the onset of behavioral changes indicative of vestibular dysfunction. InA, at 1 hr postlesion, although the rat failed to exhibit a full disruption of vestibular function, the plot illustrates a loss of the directional firing of the cell. Thus, for this case, this result suggests a shorter latency in the sodium arsanilate-induced disruption of HD cell discharge. For B and E, each prelesion session contained two HD cells recorded simultaneously from the same electrode. These cells exhibited similar time courses in their vestibular lesion-induced loss of directional firing. F,Waveform tracings of the discriminated signal of the cell depicted inC, sampled over the onset of vestibular dysfunction. The transistor–transistor logic pulse produced by the window discriminators served as the oscilloscope trigger to generate these waveforms. These tracings were reproduced from photographic (Polaroid) images taken from stored oscilloscope traces, which were, in turn, digitized and contrast-enhanced. Calibration bar, 50 μV, 200 μsec.