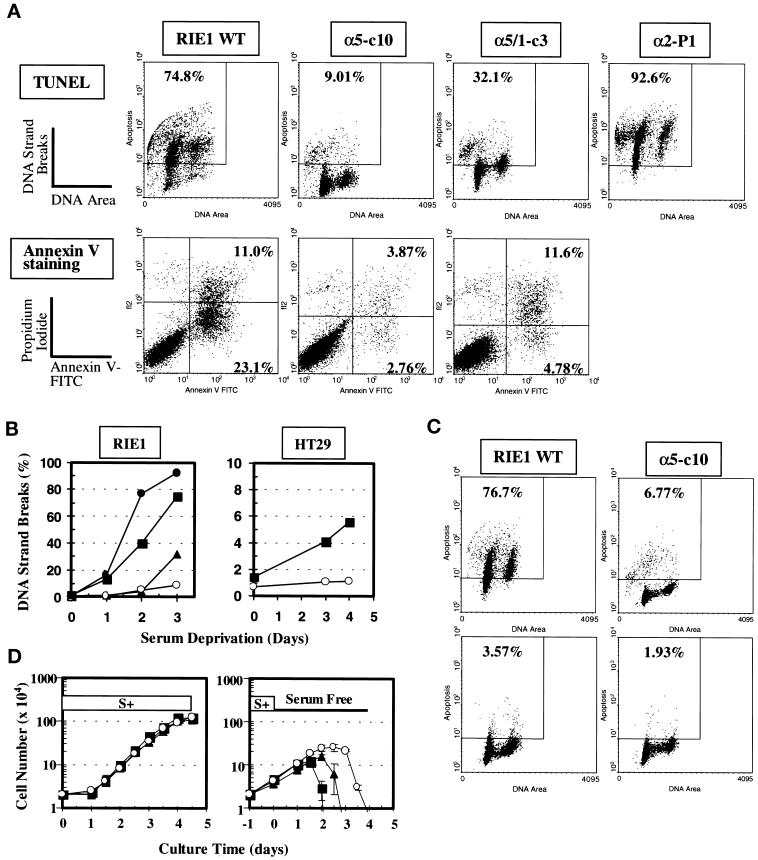
Figure 2.
Apoptosis mediated by serum deprivation in RIE1 WT and its various transfectants. (A) Apoptosis measured by two different methods (TUNEL and annexin V staining). Cells were cultured for 72 h in serum-free conditions (DMEM-H with 0.1% BSA), harvested, and then measured for apoptosis. Upper panels, Apoptosis measured by the TUNEL method. The square in each histogram represents the area in which cells are considered apoptotic. The numerical percentage of apoptotic cells versus total cells is shown. Lower panels, Apoptosis analyzed by annexin V staining. The percentage values represent late apoptotic (upper right quadrant) and early apoptotic (lower right quadrant) populations versus total cells. α5-c10 is a clone expressing full-length α5; α5/1-c3 is a clone expressing a tailless α5; α2-P1 is a pool expressing full-length α2. (B) Trends for apoptosis attributable to serum deprivation in RIE1 cells (left) and HT29 cells (right). Apoptosis was analyzed by the TUNEL assay. (Left) ▪, RIE1 WT; ▴, α5/1-c3; ○, α5-c10; ●, α2-P1. (Right) ▪, HT29 WT; ○; HT29 c28, which expresses full-length α5. Data shown are representative of at least two independent experiments. (C) Block of apoptosis by a general caspase inhibitor, BDfmk. Cells were serum starved for 48 h without (upper panels) or with (lower panels) treatment with 100 μM BDfmk before evaluation of apoptosis with the TUNEL assay. The inhibitor was replenished every 24 h. (D) Growth curves of RIE1 transfectants in normal (left) or serum-free (right) culture conditions. In the right panel, cultures were switched to serum-free conditions after 1 d in normal serum-replete culture. Cell counts were done in triplicate by hemocytometry. ▪, RIE1 WT; ▴, α5/1-c3; ○, α5-c10.

