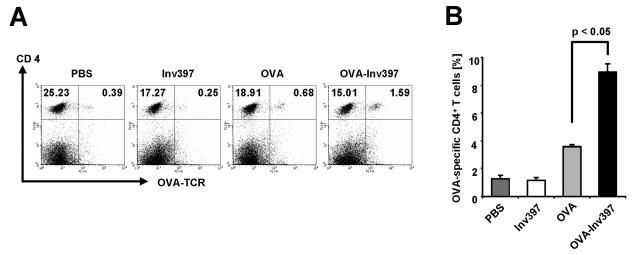
FIG. 3.
Frequency of antigen-specific CD4+ T cells in vivo. Three mice received transgenic T cells 3 days prior to immunization with protein-coated microparticles or PBS. The percentage of T cells positive for specific TCR and CD4 out of all CD4+ T cells was determined by fluorescence-activated cell sorting analysis. (A) Double staining with anti-CD4-PE and anti-DO11.10 clonotypic TCR-FITC antibody. Numbers in quadrants indicate the percentages of gated viable cells. (B) CD4+ OVA-specific TCR+ T cells per number of total splenic CD4+ T cells after intraperitoneal immunization. Means ± standard deviations of three animals per group are shown. The results are representative of three independent experiments.

