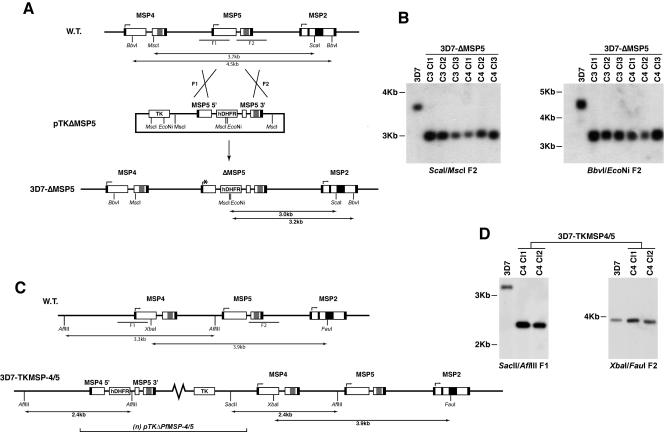
FIG. 3.
Mapping of the integration events in MSP-5 knockout and MSP-4 truncated 5′ UTR lines. (A) Schematic diagram detailing the strategy employed in targeting of the endogenous msp-5 gene. The black boxes represent sequences encoding the signal peptides and the GPI attachment moieties. The central repeat regions that define the MSP-2 alleles are also indicated by the black boxes toward the center of the MSP-2 coding sequence. Gray boxes represent the EGF-like domains. (B) Southern blot of restricted genomic DNA isolated from P. falciparum 3D7 parental parasites and a number of 3D7-ΔMSP5 clones (cycles 3 and 4 [C3 and C4]). Both blots (ScaI-MscI and BbvI-EcoNi) were probed with the MSP-5 3′ targeting sequence (F2) delineated in panel A. (C) Schematic diagram detailing the outcome of an attempt to target PfMSP-4 and PfMSP-5 in the one transfected line, resulting in a 5′ single recombination event integrating one or more copies of the episome. (D) Southern blot of restricted genomic DNA isolated from P. falciparum 3D7 parental parasites and two clones of 3D7-TKMSP4/5 parasites from late drug cycles (C4). Blot SacII-AflIII was probed with the MSP-4 5′ targeting sequence (F1), and blot XbaI-FauI was probed with the MSP-5 3′ targeting sequence (F2) delineated in panel C. W.T., wild type; Cl, clone.

