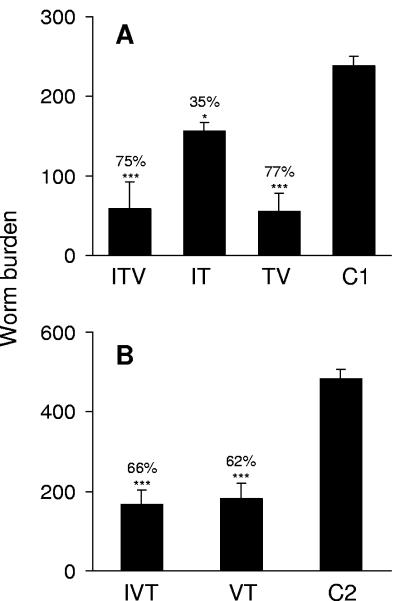
FIG. 3.
Worm burdens after challenge and perfusion for experiment A (infection, treatment, vaccination, challenge) (A) and experiment B (infection, vaccination, treatment, challenge) (B). The percent protection relative to controls is indicated above each bar: ✽✽✽, P < 0.001; ✽✽, P < 0.01; ✽, P < 0.05. Values are means + the SEM (n = 5 to 7).

