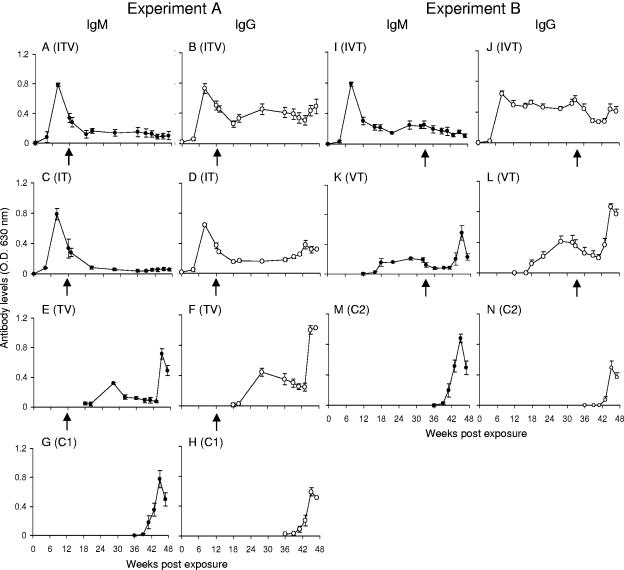
FIG. 4.
Antibody profiles over the whole time course probed by using 0-3hRAP (cercarial secretions). For experiment A (infection, treatment, vaccination, challenge) the IgM levels are plotted in panels A, C, E, and G, and the IgG levels are plotted in panels B, D, F, and H for groups ITV, IT, TV, and C1, respectively. For experiment B (infection, vaccination, treatment, challenge) the IgM levels are plotted in panels I, K, and M and the IgG levels are plotted in panels J, L, and N for groups IVT, VT, and C2, respectively. Five vaccinations were given at 4-week intervals starting at week 18 in experiment A and week 14 in experiment B. PZQ treatment (arrow below x axis) was at weeks 12 and 13 in experiment A and at weeks 32 and 33 in experiment B. Values are means + the SEM (n = 5 to 7).

