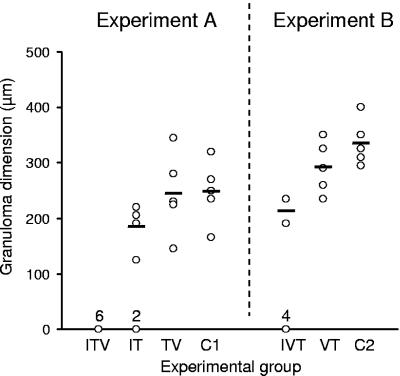
FIG. 5.
Hepatic egg granuloma dimensions at 10 weeks postchallenge for experiment A (infection, treatment, vaccination, challenge) and experiment B (infection, vaccination, treatment, challenge). Circles and solid bars represent individual and mean values, respectively (n = 5 to 7). The number of animals in each group with zero granulomas is depicted above the x axis.

