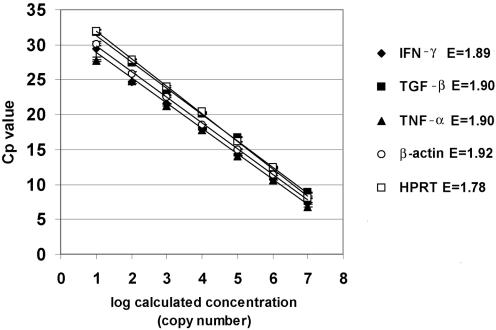
FIG. 1.
Standard curves for TNF-α, TGF-β, and IFN-γ as well as the two housekeeping genes HPRT and β-actin. Curves were constructed using 10-fold dilutions ranging from 107 copies to 1 copy/μl. The curves were obtained by plotting the mean values of log-calculated concentration (copy number) versus the Cp. The error bars show the standard deviations (n = 3). The error (E) values of the standard curves are the mean squared errors calculated by the LightCycler software. The regression coefficient was −1.00 in all cases.

