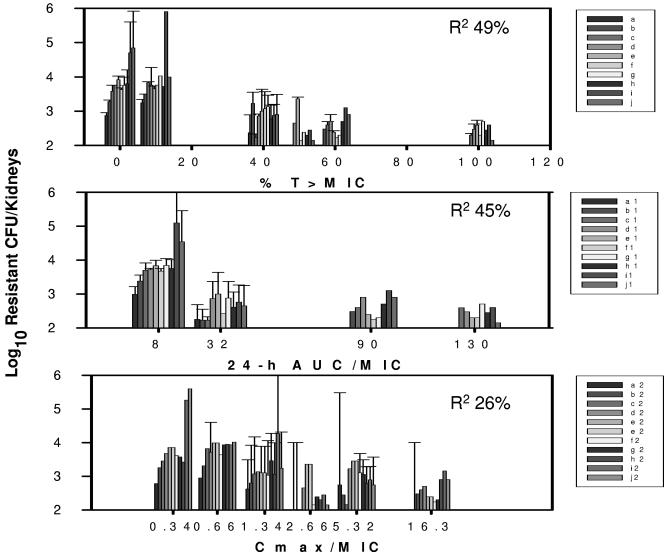
FIG. 5.
Relationship between fluconazole %T > MIC, 24-h AUC/MIC, and Cmax/MIC and the burden of growth of C. albicans in kidneys of mice with a resistant phenotype based on growth on fluconazole-containing agar. Each bar indicates a 72-h in vivo drug exposure. Each bar represents mean data from two mice. The error bars represent standard deviations. R2 is the coefficient of determination.

