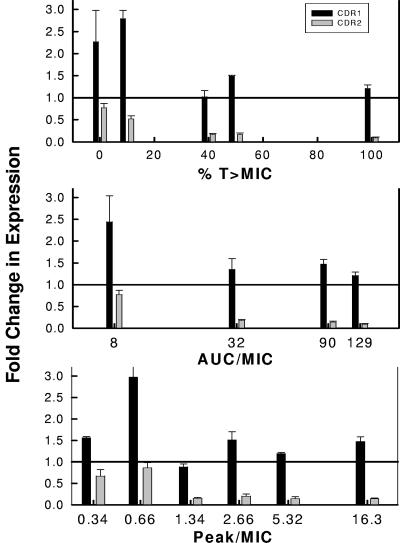
FIG. 7.
Relationship between in vivo fluconazole %T > MIC, 24-h AUC/MIC, and Cmax/MIC and the expression of CDR1 and CDR2 in C. albicans from infected mice. Each bar represents the change (n-fold) in mRNA abundance of an archived cell population relative to the beginning C. albicans K1 population. The bars represent the means and standard deviations from three biological replicates using quantitative RT-PCR. The RT-PCR assay was performed in triplicate for each biological replicate.

