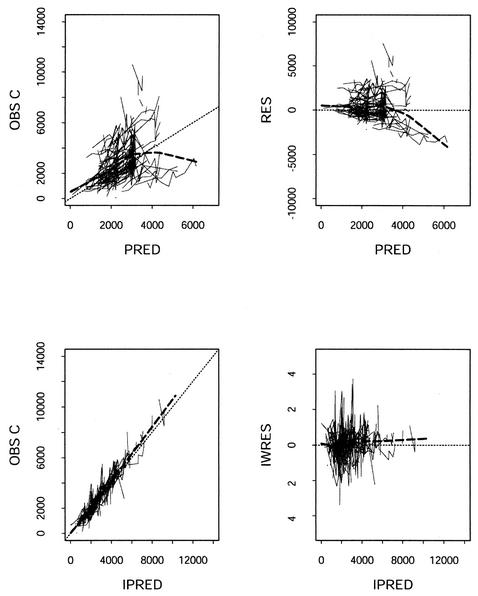
FIG. 1.
Goodness-of-fit plots of the final PK model for EFV. Left panels, observed (OBS) concentrations (C) versus PRED and IPRED; heavy dashed lines, smoothing of concentrations versus PRED and IPRED. Right panels, population residuals (RES) and weighted individual residuals (IWRES) versus PRED and IPRED; heavy dashed lines, smoothing of RES (IWRES) versus PRED (IPRED). The fine dashed lines indicate lines of identity in the left panels and the ordinate value of 0 in the right panels.

