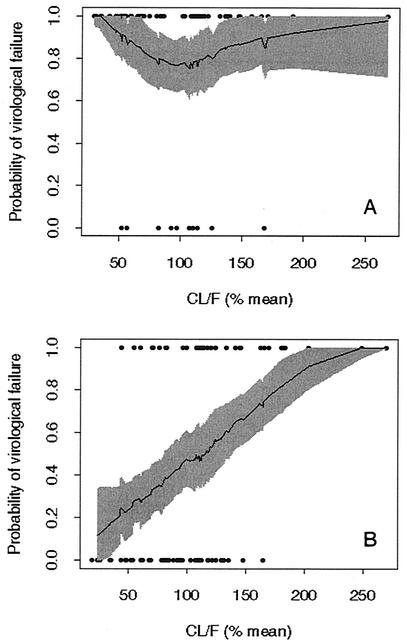
FIG. 3.
Probability of virological failure by 1 year versus scaled individual EFV CL/F among patients in AACTG study 398 with EFV PK data. (A) Patients previously exposed to NNRTIs; (B) patients not previously exposed to NNRTIs. CL/F is expressed as the percentage of the population average CL/F. Points are individual datum points: virological failure was given a value of 1, and virological nonfailure was given a value of 0. Data for only two individuals were censored before 300 days (plotted as nonfailures). The shaded areas in both plots delimit pointwise 90% confidence intervals obtained by bootstrapping (10) the data (500 replications). The solid central line in each plot is the mean of the bootstrapped smoothed data.

