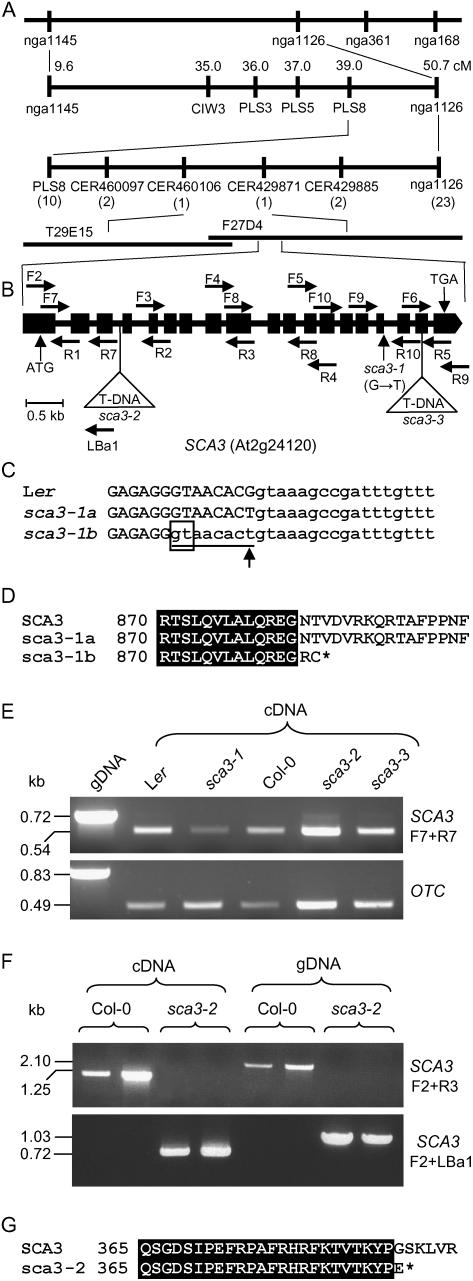
Figure 2.
Positional cloning and structural analysis of the SCA3 gene. A, Map-based strategy followed to identify the SCA3 gene. After studying 882 chromosomes, a total of 33 recombinant events (in parentheses) were identified in a region of 11.7 cm on chromosome 2, flanked by the PLS8 and nga1126 markers. A candidate interval of 70 kb was finally delimited, flanked by the CER460106 and CER429871 markers and encompassing the T29E15 and F27D4 bacterial artificial chromosome clones, which included the At2g24060 to At2g24200 annotated genes. B, Structure of the SCA3 gene, with indication of the position and nature of the sca3 mutations. Exons and introns are indicated by black boxes and lines, respectively. Triangles indicate T-DNA insertions. Horizontal arrows indicate the oligonucleotides used to characterize the structure and expression of SCA3, which are not drawn to scale. C, Alignment of the sixteenth exon-intron junction region of the SCA3 gene in the wild-type Ler and the sca3-1 mutant. The sequences shown correspond to the single splicing pattern found in the wild-type SCA3 allele (Ler) and the two detected in the sca3-1 mutant (here named sca3-1a and sca3-1b). Upper- and lowercase letters indicate exonic and intronic sequences, respectively. The eight-nucleotide segment absent from sca3-1b mRNA is underlined. An arrowhead indicates the single-nucleotide change found in sca3-1 genomic DNA. The cryptic splicing donor site within exon 16 used in sca3-1b is boxed. D, Alignment of the amino acid sequences corresponding to the C-terminal part of the protein products of the wild-type SCA3 and the mutant sca3-1 alleles of the SCA3 gene. An asterisk denotes a stop codon. E, Expression analysis of the SCA3 gene by RT-PCR in sca3/sca3 and wild-type individuals. The bands shown were obtained after PCR amplifications were performed using as a template genomic DNA (gDNA) or RNA extracted from 3-week-old plants and reverse transcribed, and the primers shown. The OTC gene was used as an internal control. F, Expression analysis of the SCA3 gene by RT-PCR in sca3-2/sca3-2 and Col-0 individuals. The bands shown were obtained after PCR amplifications performed using as a template gDNA or RNA extracted from 3-week-old plants and reverse transcribed, and the primers shown. G, Alignment of the amino acid sequences corresponding to the protein products of the wild-type SCA3 and the mutant sca3-2 alleles of the SCA3 gene. An asterisk denotes a stop codon.

