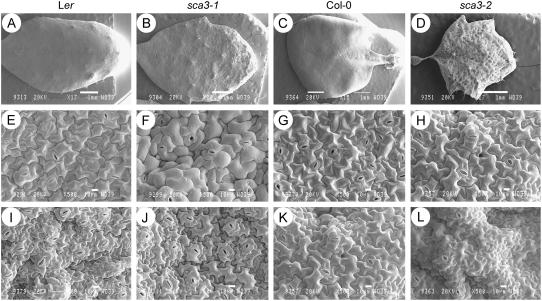
Figure 4.
Scanning electron micrographs of sca3/sca3 leaves. Micrographs are shown of the adaxial surface (A–D) of whole leaves and details of their adaxial (E–H) and abaxial epidermises (I–L). All plants were homozygous for the mutations shown. Leaves were collected 28 d after sowing. Scale bars indicate 1 mm (A–D) and 10 μm (E–L).

