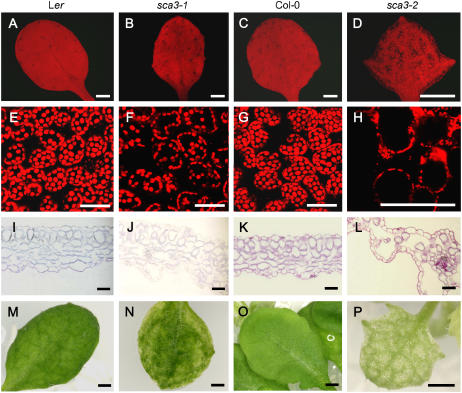
Figure 5.
Reduced cell density in the mesophyll of sca3/sca3 leaves. A to H, Confocal micrographs, showing fluorescing chlorophyll within mesophyll cells of whole third leaves (A–D), and details of the mesophyll (E–H). Transverse sections of leaves (I–L) and whole leaves (M–P). All plants were homozygous for the mutations shown. Leaves were collected 28 d after sowing. Scale bars indicate 1 mm (A–D), 50 μm (E–L), and 0.5 mm (M–P).

