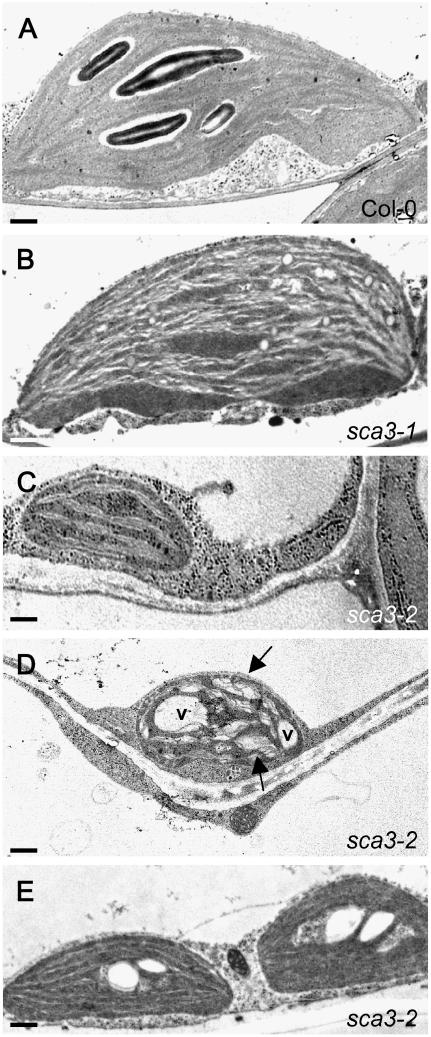
Figure 6.
Transmission electron micrographs of sca3/sca3 chloroplasts. A to C, Representative chloroplasts of Col-0 and the sca mutants. Chloroplasts of Ler and Col-0 were indistinguishable and no differences were found between those of their mesophyll cells and those of cells neighboring the midvein. D, One of the chloroplasts occasionally seen in sca3-2/sca3-2 mesophyll cells, showing enlarged thylakoids (arrows) and vacuoles (v). E, Chloroplasts of a cell adjacent to the midvein of the sca3-2/sca3-2 mutant. All plants were homozygous for the mutations shown. All leaves were collected from the third node 21 d after sowing. Scale bars indicate 1.5 μm (A and B), 0.6 μm (C and D), and 1.2 μm (E).

