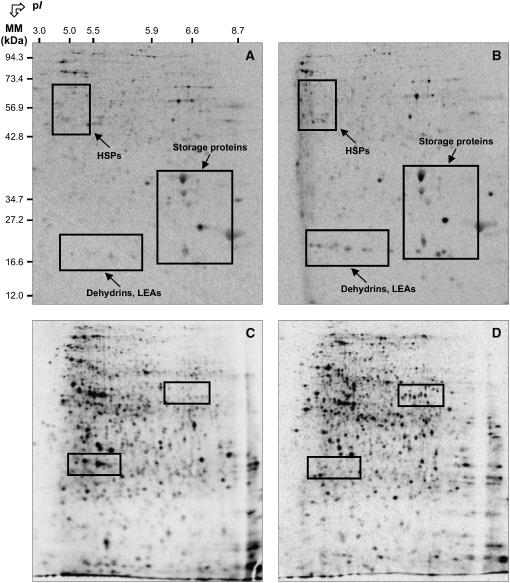
Figure 6.
Comparison of de novo protein synthesis patterns during germination of wild-type Arabidopsis Ler ecotype seeds in the presence or absence of 0.5 mm SA. A and B, Protein profiles of de novo synthesized proteins in the time period between 0 and 8 h of imbibition in water (A) or 0.5 mm SA (B). C and D, Protein profiles of de novo synthesized proteins in the time period between 16 and 24 h of imbibition in water (C) or 0.5 mm SA (D). Radiolabeling of proteins was carried out by introducing [35S]-Met in the germination assays, as described in “Materials and Methods.” Proteins were extracted, submitted to 2D gel electrophoresis, and the radiolabeled proteins revealed as described in “Materials and Methods.” The labeled protein spots in indicated windows were identified either by mass spectrometry or by comparison with Arabidopsis seed protein reference maps (Gallardo et al., 2001, 2002a; http://seed.proteome.free.fr). Several labeled spots exhibiting contrasting specific accumulation in the presence or absence of SA could not be identified because they had no match with proteins listed in Arabidopsis seed protein reference maps. Protein spot quantification was carried out as described in “Materials and Methods” and from at least three gels for each seed sample.

