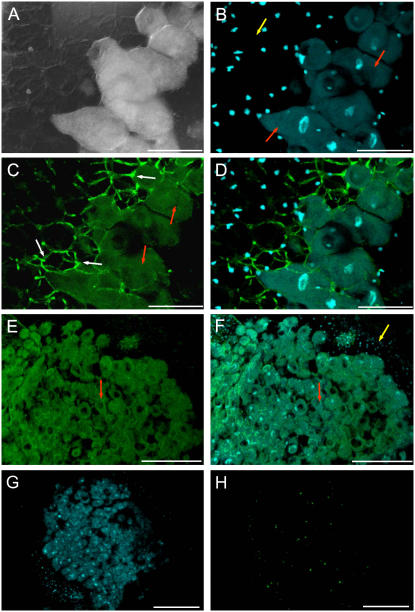
Figure 5.
Localization of GalLDH mRNA in Lotus (determinate) nodules. A, DIC image showing the peripheral tissues and infected region of a nodule. Note the large polygonal, infected cells. B, DAPI staining (blue fluorescence) of the same nodule section as A. The nuclei of infected cells (red arrows) are larger than those of cortical cells (yellow arrow) and are localized toward the center of the cells. C, FISH signal in the same nodule section as A with GalLDH antisense probe. The green fluorescence is localized in the polygonal, large infected cells, with poor signal in the peripheral tissue. Note also the bright green autofluorescence of cell walls at the peripheral cell layers adjacent to infected cells (white arrows). Autofluoresecence was often observed at high magnifications but can be easily distinguished from the FISH fluorescence signal of the host cell cytoplasm (red arrows). D, Merged image of DAPI and FISH fluorescence signals. E, FISH signal in the central, infected region of nodules (red arrows). F, Merged image of DAPI and FISH signals. Note the labeling of nuclei in the cortical cells (yellow arrow), which display a low fluorescence signal compared with the infected cells (red arrows). G, Low magnification view of a nodule after DAPI labeling. H, The same nodule section as G incubated with a GalLDH sense probe as a negative control. Note the virtual absence of green fluorescence signal. Magnification bars = 75 μm in A to D; 300 μm in E to H.

