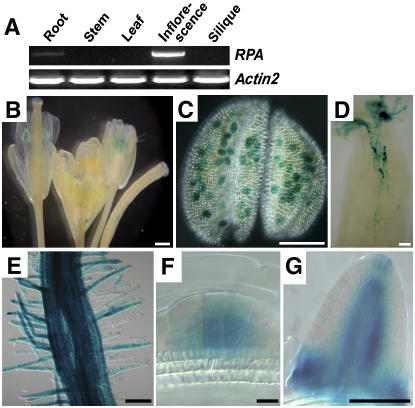
Figure 2.
Expression pattern of the RPA gene. RNA was extracted from tissues as indicated and subjected to RT-PCR analysis (A) and the RPA expression pattern was revealed by the GUS reporter in Pro:RPA-GUS:Ter transgenic plants (B–G). A, RT-PCR result showing RPA expression in inflorescence and root, not in other tissues as indicated. Actin2 is used as an internal control. B, Inflorescence shows GUS staining in the anther. C, Micrograph of an anther showing GUS staining in pollen grains. D, Micrograph of a pollinated pistil showing GUS staining in pollen tubes. E, Micrograph showing GUS activity in root and root hair. The intensity of the staining does not reflect the expression level. F, Micrograph showing GUS staining in lateral root primordial cells. G, Micrograph showing GUS staining in a lateral root. Scale bars, 500 μm (B–E); 10 μm (F); and 100 μm (G).

