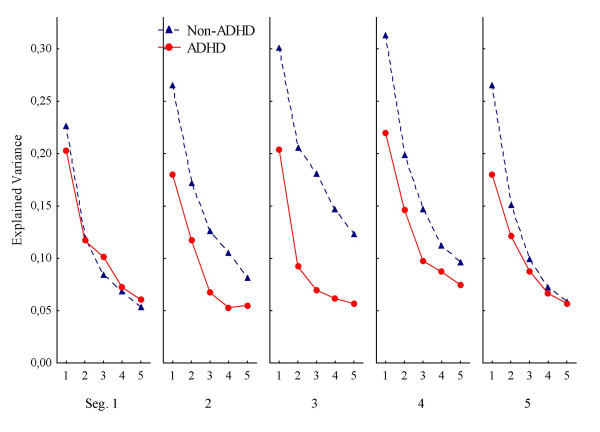
Figure 1.
Response predictability according to side of the screen. Predictability of consecutive responses according to side of the screen (left or right), depicted as mean explained variance (autocorrelations squared), across segments (Seg. 1–5) and lags (1–5 per segment), for ADHD and non-ADHD groups. Abbreviations: Seg.: segment of session. Lag: number of responses that has to be correlated to the present one, i.e., correlations between response n and n+1 is the first lag, between n and n+2 is the second lag, and so on up to correlations between response n and n+5 being the fifth lag.

