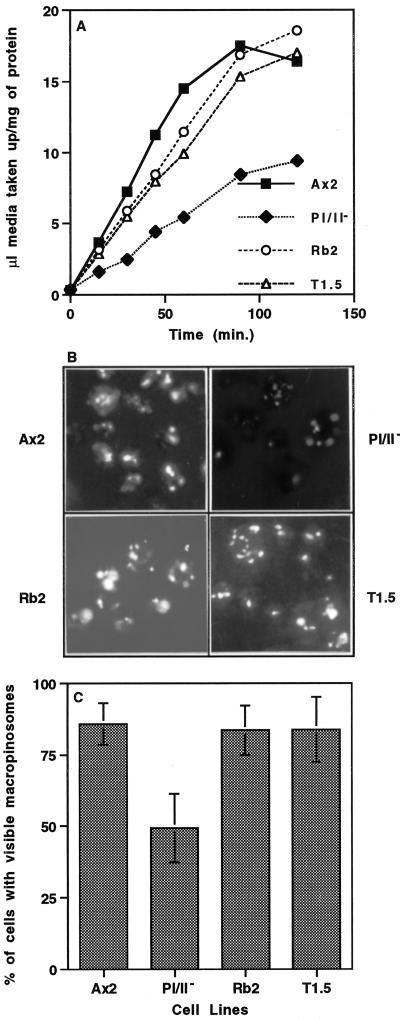
Figure 1.
Profilin-null cells are defective in pinocytosis, and disruption of lmpA in a profilin-null background rescues this phenotype. (A) To measure the rate of pinocytosis, the parental cell line (Ax2) and three mutant cell lines (pI/II−, T1.5, and Rb2) were incubated in growth medium with 2 mg/ml FITC-dextran. The last two strains (T1.5 and Rb2) contain mutations that inactivate both profilin genes as well as the lmpA gene described elsewhere in RESULTS. Intracellular fluorescence was measured at the times indicated, as described in MATERIALS AND METHODS, and the volume of fluid phase internalized per milligram of protein was plotted. The rate of fluid phase uptake in all cell lines was linear over 60 min, and the initial rate of fluid phase uptake measured over 30 min was 0.24 ± 0.06 μl medium·mg−1 protein·min−1, 0.08 ± 0.02 μl medium·mg−1 protein·min−1, 0.19 ± 0.02 μl medium·mg−1 protein·min−1, and 0.17 ± 0.02 μl medium·mg−1 protein·min−1 for Ax2, pI/II−, Rb2, and T1.5, respectively (mean ± SD, n = 4 for all). Statistical analysis indicated that the rate of fluid phase uptake by the pI/II− cell line was significantly lower than that by the parental Ax2 cell line (p = 0.0019, n = 4) and that the rates of uptake of fluid phase by the Rb2 and T1.5 cell lines were not significantly different from that of Ax2 (p > 0.05, n = 4). (B and C) To examine the process of macropinocytosis, cells that adhered to coverslips were labeled for 2 min with FITC-dextran (2 mg/ml in growth medium). The labeled cells were fixed with formaldehyde (1% [vol/vol] in growth medium) and then visualized by fluorescence microscopy (B), and the number of cells with macropinosomes was scored visually (C). Statistical analysis indicated that 49.3 ± 11.0% (n = 100) of pI/II− cells demonstrated macropinosomes, which was significantly lower (p ≤ 0.0003) than the percentage of parental (85.9 ± 7.2%, n = 100), Rb2 (83.6 ± 8.6%, n = 100), or T1.5 (83.9 ± 11.3%, n = 100) cells with macropinosomes. Moreover, the percentage of Ax2, Rb2, and T1.5 cell lines displaying macropinosomes was not significantly different from one another (p > 0.05).

