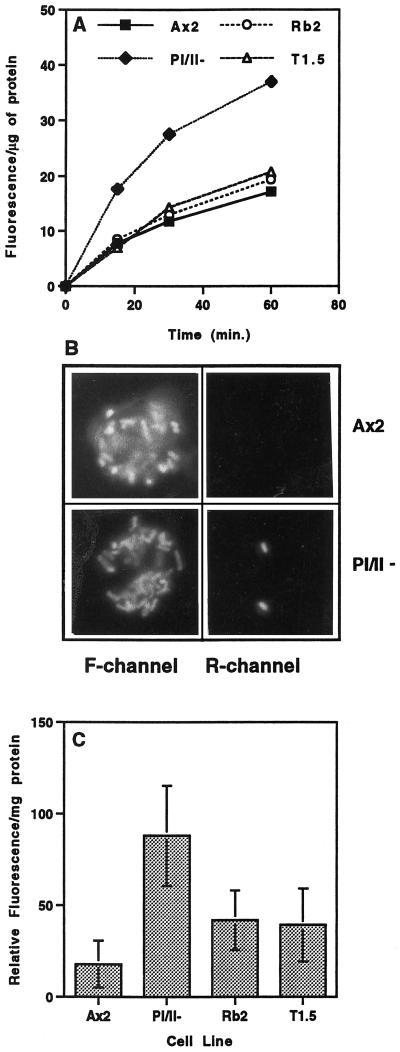
Figure 3.
Profilin acts as a negative regulator of phagocytosis, and disruption of lmpA in a profilin-null background suppresses this action. (A) To measure the rate of phagocytosis, the parental cell line (Ax2) and the three mutant cell lines were incubated in growth medium with fluorescent latex beads (1 μm; 50 beads/cell). Intracellular fluorescence was measured at the times indicated, as described in MATERIALS AND METHODS, and the amount of fluorescence internalized per microgram of protein was plotted. Statistical analysis indicated that the rate of phagocytosis seen in the pI/II− cell line was significantly higher than that seen in the parental Ax2 cell line (p = 0.0110, n = 3) and that the rates of uptake of fluorescent beads by the Rb2 and T1.5 cell lines (in which both the profilin genes and the DdLIMP gene have been disrupted) were not significantly different from that of Ax2 (p > 0.05, n = 3). (B) This experiment was done to rule out the possibility that surface changes of profilin-null cells resulted in enhanced binding but not enhanced phagocytosis of bacteria. Ax2 and profilin-null cells that had been incubated with fluorescein-labeled bacteria were treated with ethidium bromide, which binds to exposed (not internalized) bacteria and allows them to fluoresce in the rhodamine (R) channel as well as the fluorescein (F) channel. Treated cells were then examined by fluorescence microscopy with the use of an Olympus epifluorescence microscope, as described (Seastone et al., 1998, 1999). (C) Quantitation of the F-actin fraction of Ax2 and the three mutant cell lines by measuring the relative rhodamine fluorescence per milligram of total protein. Mean ± SD was calculated from 14 assays for each strain: Ax2, 17.9 ± 12.9; pI/II−, 88.0 ± 27.3; Rb2, 41.9 ± 16.3; T1.5, 39.2 ± 19.9. Statistical analysis indicated that the F-actin content in the pI/II− cell line was significantly higher than that in the parental Ax2 cell line (p < 0.001, n = 14). The partially suppressed F-actin levels in the lmpA mutants Rb2 and T1.5 were significantly lower than that in the pI/II− cell line (p < 0.001, n = 14) but still higher than that in the Ax2 strain (p < 0.001, n = 14). Rb2 and T1.5 were not significantly different from each other (p > 0.05, n = 14).

