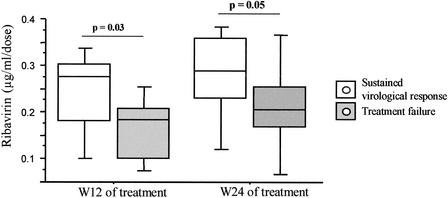
FIG. 2.
Concentration of ribavirin in sera from 11 responders and 13 nonresponders after 12 and 24 weeks of ribavirin and interferon combination therapy. Data are presented as box plots in which 50% of the values lie within the box. The horizontal lines drawn through the middle of the boxes represent the median values. The top and bottom of each box are the 10th and 90th percentiles of all values, respectively. P values were 0.03 and 0.05 for responder patients versus nonresponder patients after 3 and 6 months of treatment, respectively.

