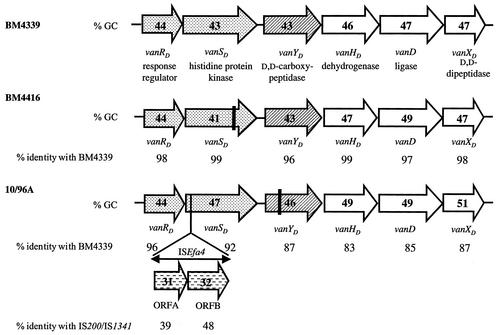
FIG. 3.
Comparison of vanD gene clusters. Arrows represent coding sequences and indicate direction of transcription. The two-component regulatory systems are represented by dotted arrows, the d,d-carboxypeptidases are represented by hatched arrows, and the genes necessary for resistance are represented by open arrows. The guanosine-plus-cytosine content (% GC) is indicated in the arrows. The percentages of identity between the deduced proteins relative to those of BM4339 are indicated under the arrows. Insertion sequence ISEfa4 in 10/96A is indicated by a double-headed arrow, and horizontally dashed arrows correspond to ORFA and ORFB. The vertical bars in vanSD of BM4416 and vanYD of 10/96A indicate the positions of the frameshift mutations leading to predicted truncated proteins.

