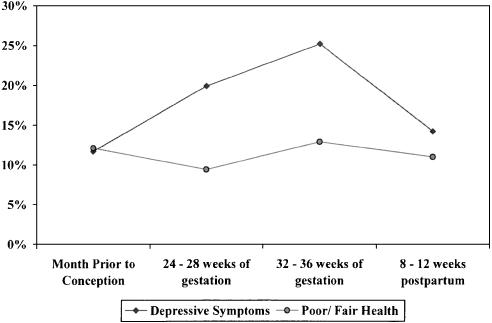
Figure 2.
Prevalence of depressive symptoms and poor or fair overall self-rated health before, during, and after pregnancy. Prevalence of depressive symptoms at each time point differs for all other time points (P≤.006). Prevalence of poor or fair health prior to conception significantly different than 24 to 28 weeks (P =.003), 24 to 28 weeks significantly different than 32 to 36 weeks (P <.001), and 32 to 36 weeks different than 8 to 12 weeks postpartum (P =.04).

