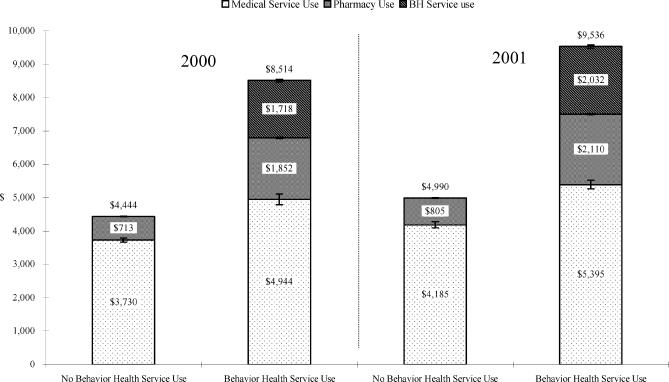
Figure 1.
Annual mean claims expenditures for medical, pharmacy, and behavioral health services per enrollee in 2000 and 2001 for those with (Group 1) and without (Group 2) behavioral health claims expenditures in two commercial plans and two public programs. I-bars represent standard error.*There were 245,744 enrollees in 2000 and 255,217 enrollees in 2001 in these plans; 74.9% and 75.0%, respectively, used medical or pharmacy services only; 9.4% and 10.7%, respectively, used at least 1 behavioral health service, and 15.8% and 14.3%, respectively, did not use any medical, pharmacy, or behavioral health services. Those with no service use (Group 3) were excluded from this comparison. Total, general medical, and pharmacy claims expenditures between those who used medical and pharmacy services only (Group 2) and those who used at least 1 behavioral health service (Group 1) were all significantly different (P <.0001) in both 2000 and 2001.

