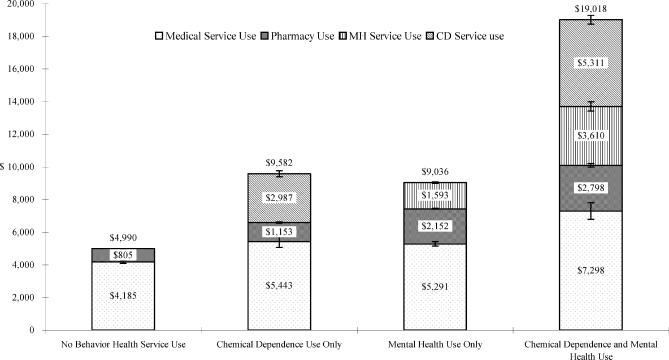
Figure 2.
Annual mean claims expenditures in 2001 for medical, pharmacy, mental health, and chemical dependence services per enrollee for those with no behavioral health service use (Group 2—2001), those with at least 1 chemical dependence service use (Group 1b—2001), those with at least 1 mental health service use (Group 1a—2001), and those with both chemical dependence and mental health service use (Group 1c—2001). I-bars represent standard error.*Among the members in the groups, 75.0% used medical or pharmacy services only; 0.8% used at least 1 chemical dependence service only; 9.4% used at least 1 mental health service only; and 0.5% used both mental health and chemical dependence services. The 14.3% who did not use any services were excluded from comparison. Total claims expenditures for each group were significantly different from the others (P <.0001) with the exception of those with chemical dependence use only versus those with mental health use only. Medical claims expenditures were significantly lower for those with no behavioral health service use (Group 2—2001) compared to those with mental health service use only (Group 1a—2001) and those with both (Group 1c—2001) (P <.0001). Pharmacy claims expenditures were different among all groups (P <.0001).

