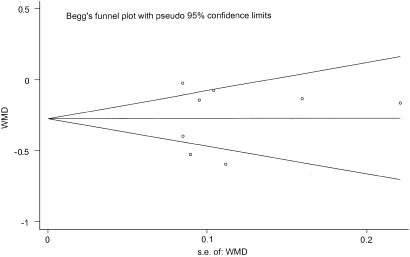
FIGURE 3.
Funnel plot of weighted mean difference (WMD) versus standard error of WMD. There is no clear asymmetry around the summary estimate, indicating that the number of small negative and small positive studies is similar, and does not indicate the presence of publication bias for this outcome measure

