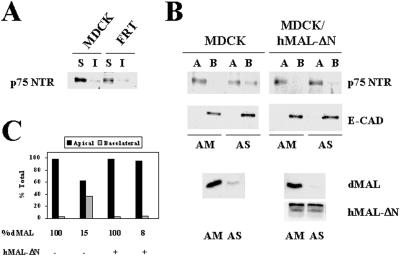
Figure 3.
MAL depletion in MDCK cells causes reduced transport of p75NTR to the apical surface and missorting to the basolateral membrane. (A) MDCK and FRT cells were infected with a recombinant adenovirus expressing p75NTR, and 8 h later the cell surface was labeled with sulfo-NHS-biotin. After extraction with 1% Triton X-100 at 4°C, the soluble and insoluble fractions were separated by centrifugation and were subjected to immunoprecipitation with anti-p75NTR antibodies. Surface p75NTR was detected by immunoblotting with streptavidin-peroxidase. Quantification of the signals obtained indicates that >90% of p75NTR was excluded from the GEM fraction in both MDCK and FRT cells. (B) MDCK cells or MDCK/hMAL-ΔN cells were transfected with AM or AS oligonucleotide, plated on tissue culture inserts, and incubated at 37°C for 48 h. Cells were then infected with a recombinant adenovirus expressing p75NTR, and 8 h later the cell surface was labeled with sulfo-NHS-biotin from either the apical or the basolateral faces of the insert. After cell lysis, the extracts were immunoprecipitated with anti-p75NTR antibodies, and surface p75NTR was detected by immunoblotting with streptavidin-peroxidase. As a control, surface expression of E-cadherin was analyzed. The endogenous (dMAL) or the exogenous tagged hMAL-ΔN levels in these cells were examined by immunoblot analysis with mAb 2E5 or 9E10, respectively. (C) Quantitative analysis of the effect of MAL depletion on the polarized delivery p75NTR. The intensity of the apical and basolateral signal corresponding to newly delivered surface p75NTR was quantified. The values obtained are represented as percentages of biotinylated p75NTR on the apical (black bars) or basolateral (gray bars) surface.

