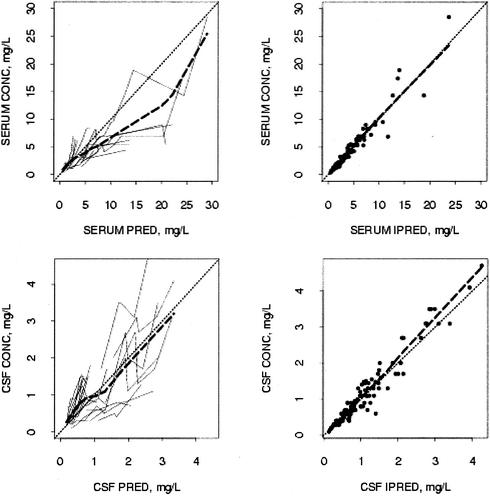
FIG. 2.
Goodness-of-fit plots of the three-compartment pharmacokinetic model for grepafloxacin. (Upper panels) Measured concentrations in serum versus predictions for the population (PRED) and predictions for individuals (IPRED). (Lower panels) Measured concentrations in CSF versus predictions for the population and predictions for individuals. Each fine solid line in the left panels represents one animal. Fine dashed lines, lines of identity; heavy dashed lines, smoothed curves for the measured concentrations versus the predictions for the population and predictions for individuals, as illustrated in the corresponding plot.

