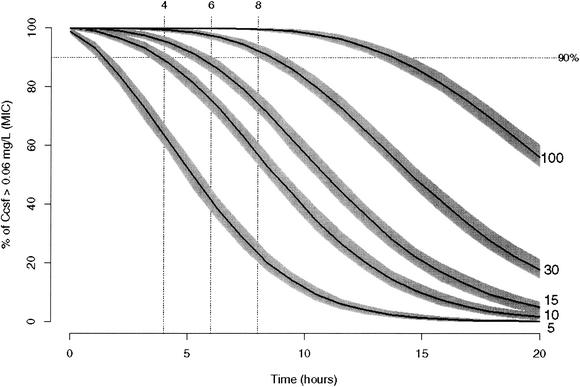
FIG. 4.
Percentage of fraction of CSF grepafloxacin concentrations greater than 0.06 mg/liter versus time as a function of dose for 400 simulated rabbits. Solid lines, profiles when the indicated dose is given; shaded areas around solid lines, 90% certainty intervals for the curves (see text); dotted line, 90% probability of having a CSF grepafloxacin concentration greater than the MIC.

