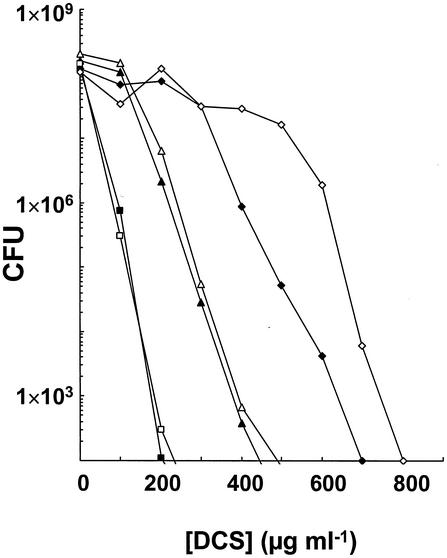
FIG. 5.
Inhibition of colony formation by DCS for various M. smegmatis strains. The curves were generated from data of a representative experiment with mc2155 (solid squares), GPM2 (open squares), GPM259 (open triangles), GPM265 (solid triangles), GPM14 (solid diamonds), and GPM260 (open diamonds). Statistical analysis for three independent experiments was performed as described in Materials and Methods. Susceptibilities to DCS can be divided into four groups (group I, mc2155 and GPM2; group II, GPM259 and GPM265; group III, GPM14; group IV, GPM260). Significant differences between groups were detected (group I versus group II, P = 0.003; group II versus group III, P = 0.025; group III versus group IV, P = 0.020), while no significant differences within groups were detected (P ≥ 0.881).

