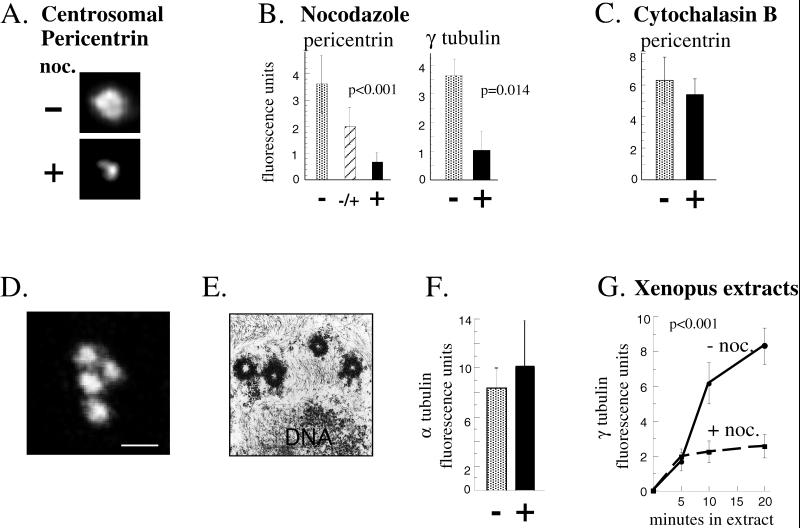
Figure 2.
Centrosome assembly of pericentrin and γ tubulin but not centrioles requires microtubules. For the experiments described in A–F, cells were treated as indicated at G1, and assays were performed in the following metaphase (see MATERIALS AND METHODS). (A) Immunofluorescence images showing pericentrin staining at centrosomes in cells incubated for one cell cycle in the presence (+) or absence (−) of nocodazole (noc.) to depolymerize microtubules. Depolymerization of microtubules was confirmed by immunofluorescence staining with anti-α tubulin antibodies. (B) Quantity of centrosome-associated pericentrin and γ tubulin assembled in the absence of microtubules as described in A. An intermediate level of pericentrin is observed when centrosomes are allowed to assemble for half of the cell cycle then exposed to nocodazole for the remaining half (middle bar in first graph). Shown are the mean ± SE of representative experiments; p values (nonparametric Wilcoxon rank sum test) reflect statistical differences between nocodazole-treated (pericentrin, n = 134; γ tubulin, n = 146) and DMSO-treated controls (pericentrin, n = 61; γ tubulin, n = 71) determined from four independent experiments. (C) Centrosome-associated levels of pericentrin in the presence (+) or absence (−) of cytochalasin B. Values represent mean ± SE for cytochalasin-treated (n = 38) and DMSO-treated control cells (n = 19) from two independent experiments. For A–C, G1 levels of centrosome fluorescence were subtracted (∼15% of total; see MATERIALS AND METHODS). (D) Confocal microscope image of α tubulin immunostaining structures representing centrioles in cells treated with nocodazole for one cell cycle. (E) Transmission electron microscopic image of a single cell treated as in D showing four centriole profiles. More than three centrioles were detected in serial sections of seven cells. (F) Quantification of α tubulin immunofluorescence in cells treated as in D (black bar; n = 18) compared with control mitotic cells (stippled bar; n = 10). Values are mean ± SE from three independent experiments. Control cells represented by the stippled bar were briefly treated with nocodazole (10 μg/ml, 60 min, 37°C) to depolymerize cytoplasmic microtubules and thus reveal centriolar α tubulin fluorescence. The values are not significantly different, further demonstrating that the centriole pair duplicated from G1 to M in the absence of cytoplasmic microtubules as in control cells. (A–F) CHO cells. (G) Microtubule-enhanced assembly of γ tubulin in Xenopus extracts. Extracts and sperm nuclei were incubated with or without nocodazole (noc.) for the times indicated (see MATERIALS AND METHODS for details). Each time point represents mean ± SE of at least 13 measurements from one experiment; p values (multiple regression with interaction term) were determined by averaging all values from three independent experiments. Values shown are ×10−5. Background centriole levels of γ tubulin (<12.2% of experimental values) were subtracted.

