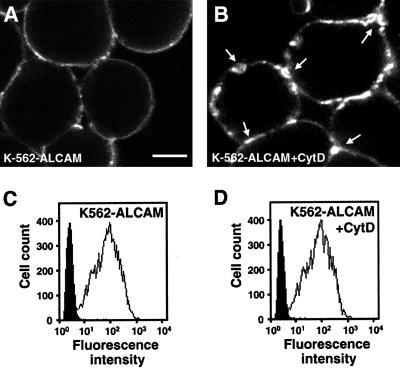
Figure 3.
Analysis of the membrane distribution of ALCAM by CLSM. K562-ALCAM cells were pretreated without (A) or with CytD (2.5 μg/ml; B) and stained with mAb AZN-L50. For each preparation, similar instrument settings were used. Bar, 5 μm. Arrows indicate ALCAM clusters at the cell surface. Flow cytometric analysis of ALCAM expression as measured on K562-ALCAM before (C) and after (D) CytD treatment was performed on the same cell samples as used for CLSM and revealed that the overall cell surface expression of ALCAM remained unaltered.

