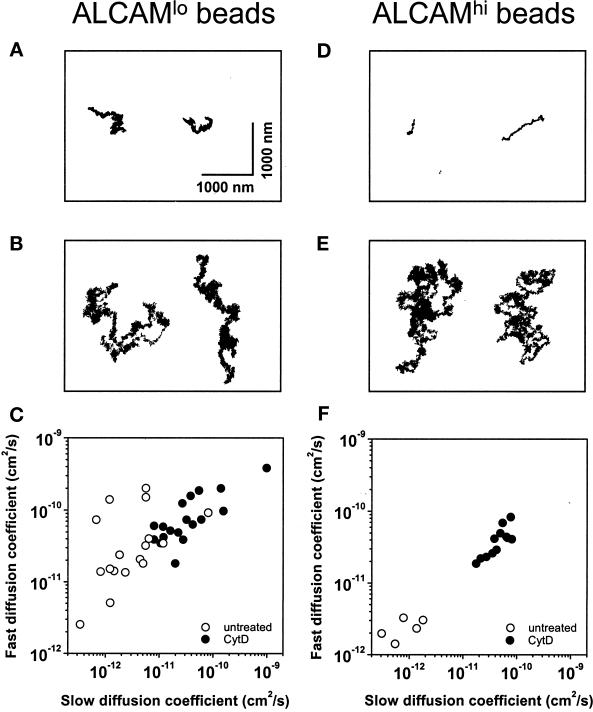
Figure 4.
Lateral mobility of ALCAM molecules in the cell membrane is increased upon CytD treatment. Representative two-dimensional trajectories of ALCAM molecules attached to ALCAMlo beads (A and B) and ALCAMhi beads (D and E) in the absence (A and D) or presence (B and E) of CytD (2.5 μg/ml) are shown. Bars for A, B, D, and E are indicated in A. Trajectories were recorded during 120 s at a sampling rate of 100 Hz. Slow and fast diffusion coefficients were calculated from the mean square displacement versus time interval plots and are shown in C and F. Open circles represent untreated cells, and closed circles represent CytD-treated cells. Diffusion coefficients of single ALCAM molecules (ALCAMlo beads; C) and of multiple molecules (ALCAMhi beads; F) are shown. The average slow diffusion coefficients are summarized in Table 1.

