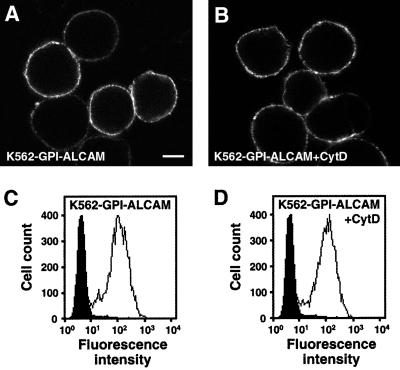
Figure 6.
Analysis of the membrane distribution of GPI-anchored ALCAM by CLSM. K562-GPI-ALCAM cells were pretreated without (A) or with CytD (2.5 μg/ml; B) and stained with mAb AZN-L50. For each preparation, similar instrument settings were used. Bar, 5 μm. The cell surface distribution of GPI-ALCAM remains unaltered after CytD treatment. Flow cytometric analysis of ALCAM expression as measured on K562-GPI-ALCAM before (C) and after (D) CytD treatment was performed on the same cell samples as used for CLSM and revealed that ALCAM expression is not changed.

