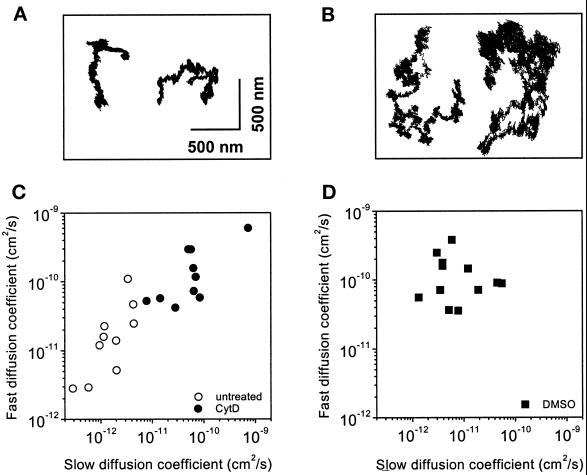
Figure 7.
The lateral mobility of GPI-ALCAM molecules in the cell membrane is increased upon CytD treatment. (A and B) Two-dimensional trajectories of GPI-ALCAM molecules attached to ALCAMlo beads in the absence (A) or presence (B) of CytD (2.5 μg/ml) are shown. Trajectories were recorded during 120s at a sampling rate of 100 Hz. Slow and fast diffusion coefficients of the GPI-anchored ALCAM molecules were calculated from the mean square displacement versus time interval plots and are shown in C. Open circles represent untreated cells, and closed circles represent CytD-treated cells. (D) Slow and fast diffusion coefficients of DMSO-treated (solvent, 0.25%) cells are plotted and are also increased. The average slow diffusion coefficients are summarized in Table 1.

