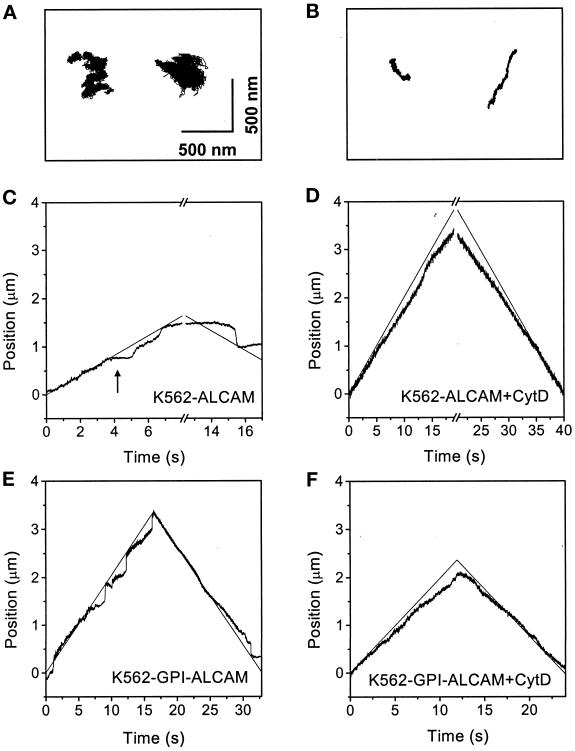
Figure 8.
Mobility of ALCAM molecules is altered over time. (A and B) Initial two-dimensional free diffusion trajectories of wild-type ALCAM engaged by ALCAMlo beads (A) and trajectories of corresponding beads 10 min after initial tracing (B). The position of the beads was recorded during 60 s at a sampling rate of 100 Hz. Over time, the free diffusion of ALCAM is decreased. (C–F) Force measurements of wild-type and GPI-ALCAM molecules. The optical trap was moved along the cell membrane at 200 nm/s. The position of the trap relative to the starting point (0 μm) is shown as a function of time by the thin line. The position relative to the starting point (0 μm) of the bead and, accordingly, the position of the ALCAM molecules in the membrane are shown as a function of time by the solid line. The positions were measured with a sampling frequency of 100 Hz. Wild-type ALCAM is analyzed in C and D in the absence (C) or presence (D) of CytD (2.5 μg/ml). GPI-ALCAM is analyzed in E and F in the absence (E) or presence (F) of CytD (2.5 μg/ml). In A, the molecule is relatively mobile but becomes more firmly attached already after 4 s (arrow), and firm attachment is most clearly seen in the reverse movement of the trap. CytD-treated wild-type ALCAM as well as CytD-treated or untreated GPI-ALCAM molecules are in all cases freely pulled over the membrane for extended periods with long freely dragged distances. The x-axis break in C and D represents the time that the bead was lost from the center of the trap, either because of restraint of the bead (C) or because of the fact that the trap reached the edges of the cell (D) before the trap was reversed.

