
Figure 4.
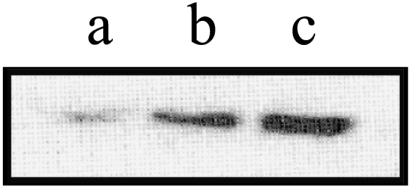
Western blot analysis of Bcl-2 in B16M-F10 cells. B16M-F10 cells were cultured x 72 hours in the absence or in the presence of t-PTER (40 µM) or QUER (20 µM) (see the legend to Table 6). Lane a, QUER; lane b, t-PTER; lane c, control untreated cells.