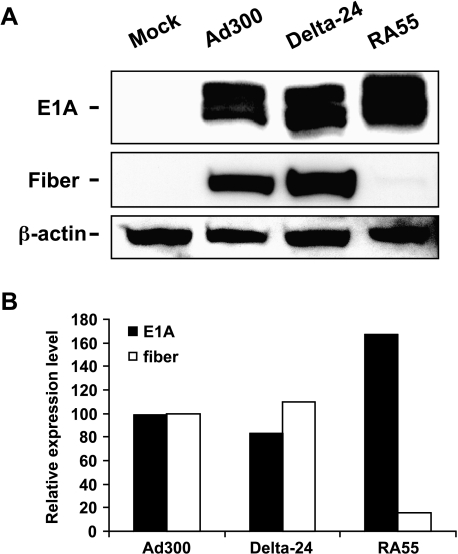
Figure 4.
Expression of adenoviral E1A and fiber proteins. (A) Cell lysates from Ad300, Delta-24, and RA55 at a dose of 50 MOI, or mock-infected U-251 MG cells were collected 24 hours after infection. Equal amount of proteins were separated on a 10% SDS-PAGE gel. E1A (35–46 kDa) and fiber protein (62 kDa) were detected with specific antibodies. β-Actin is shown as a loading control. Note that in contrast to lysates from wild-type adenovirus (Ad300) or Delta-24-infected cells, analyses of lysates from RA55-infected cells revealed a higher expression of E1A protein, whereas fiber protein was almost undetectable. (B) A quantitative representation of the expression of proteins. The amounts of E1A and fiber protein were quantified with densitometric analysis and normalized with the corresponding β-actin level. The relative protein level of E1A or fiber expressed by Ad300 is equal to 100%.

