
Figure 2.
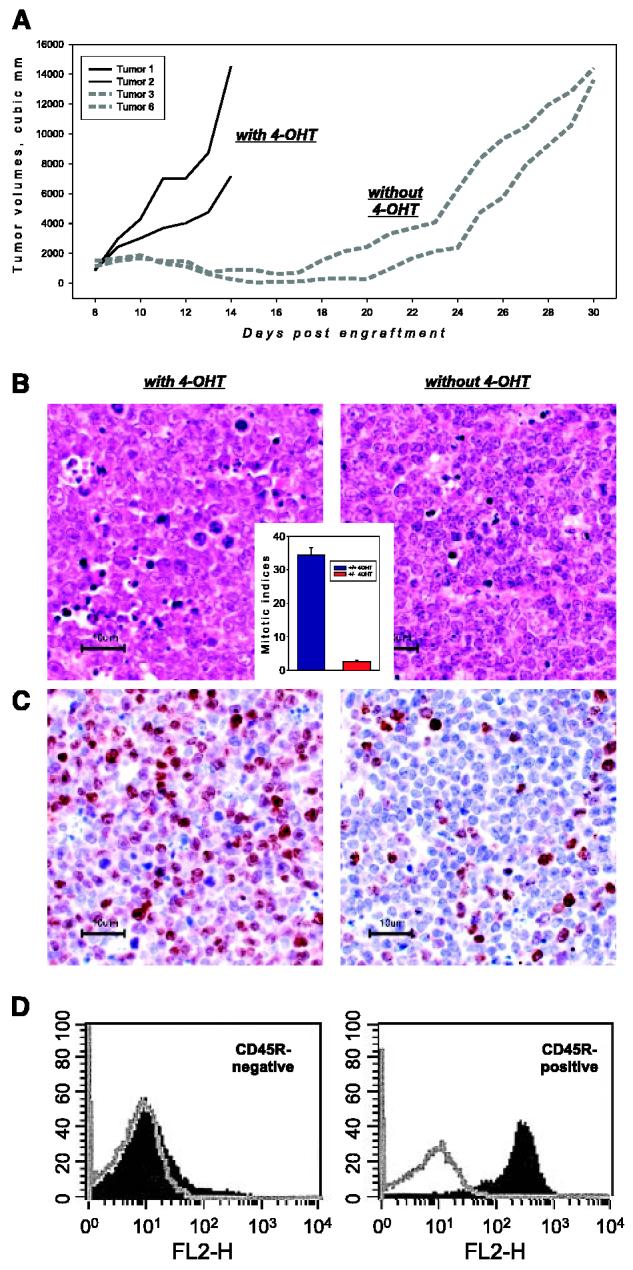
Effects of 4-OHT on subcutaneous growth of MycER tumor cells. A, tumor volumes versus days after engraftment of individual neoplasms from 4-OHT–treated (solid lines) and untreated (dotted lines) animals. B, histologic staining of representative specimens from (A). Inset, mitotic indices in MycON and MycOFF tumors on day 12. B, Ki-67 staining of the same specimens. Ki-67–positive nuclei appear in brown, all nuclei are counterstained in blue. D, flow cytometric analysis of B220 expression on the surface of cells from MycON and MycOFF tumors. Gray plots are samples stained with a control antibody.